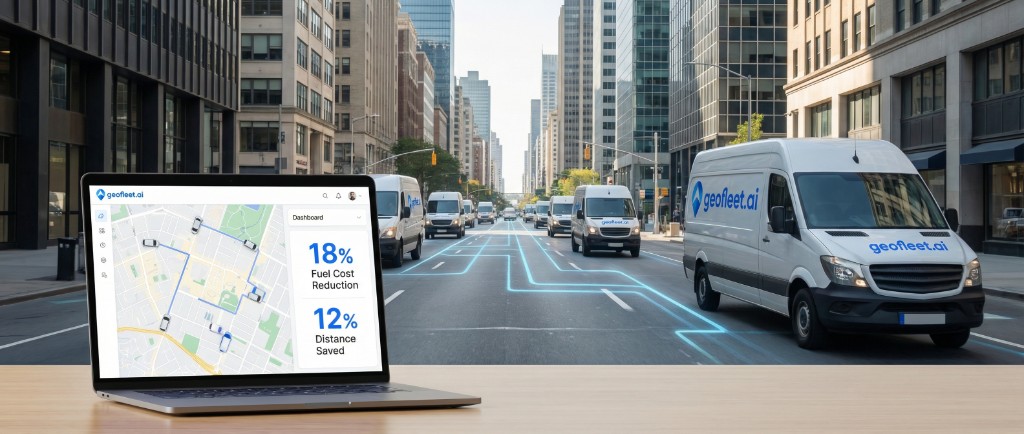
30% fuel savings and 40% more stops per driver
Regional courier operator
The challenge
Rising fuel costs and inefficient routes were eroding margins. Drivers were completing fewer stops per day than planned, and ad-hoc routing was wasting time and fuel.
The solution
AI route optimization and real-time traffic data reduced miles per delivery. Fleet visibility and the driver app improved first-attempt success and cut unnecessary backtracking.
Background
A regional courier operator runs a mixed fleet of vans and cars serving B2B and B2C customers across a large metro area. With fuel prices rising and drivers often building routes on the fly, mileage per delivery had crept up and margins were under pressure. The operations team had no single view of planned vs actual routes or driver efficiency.
Approach
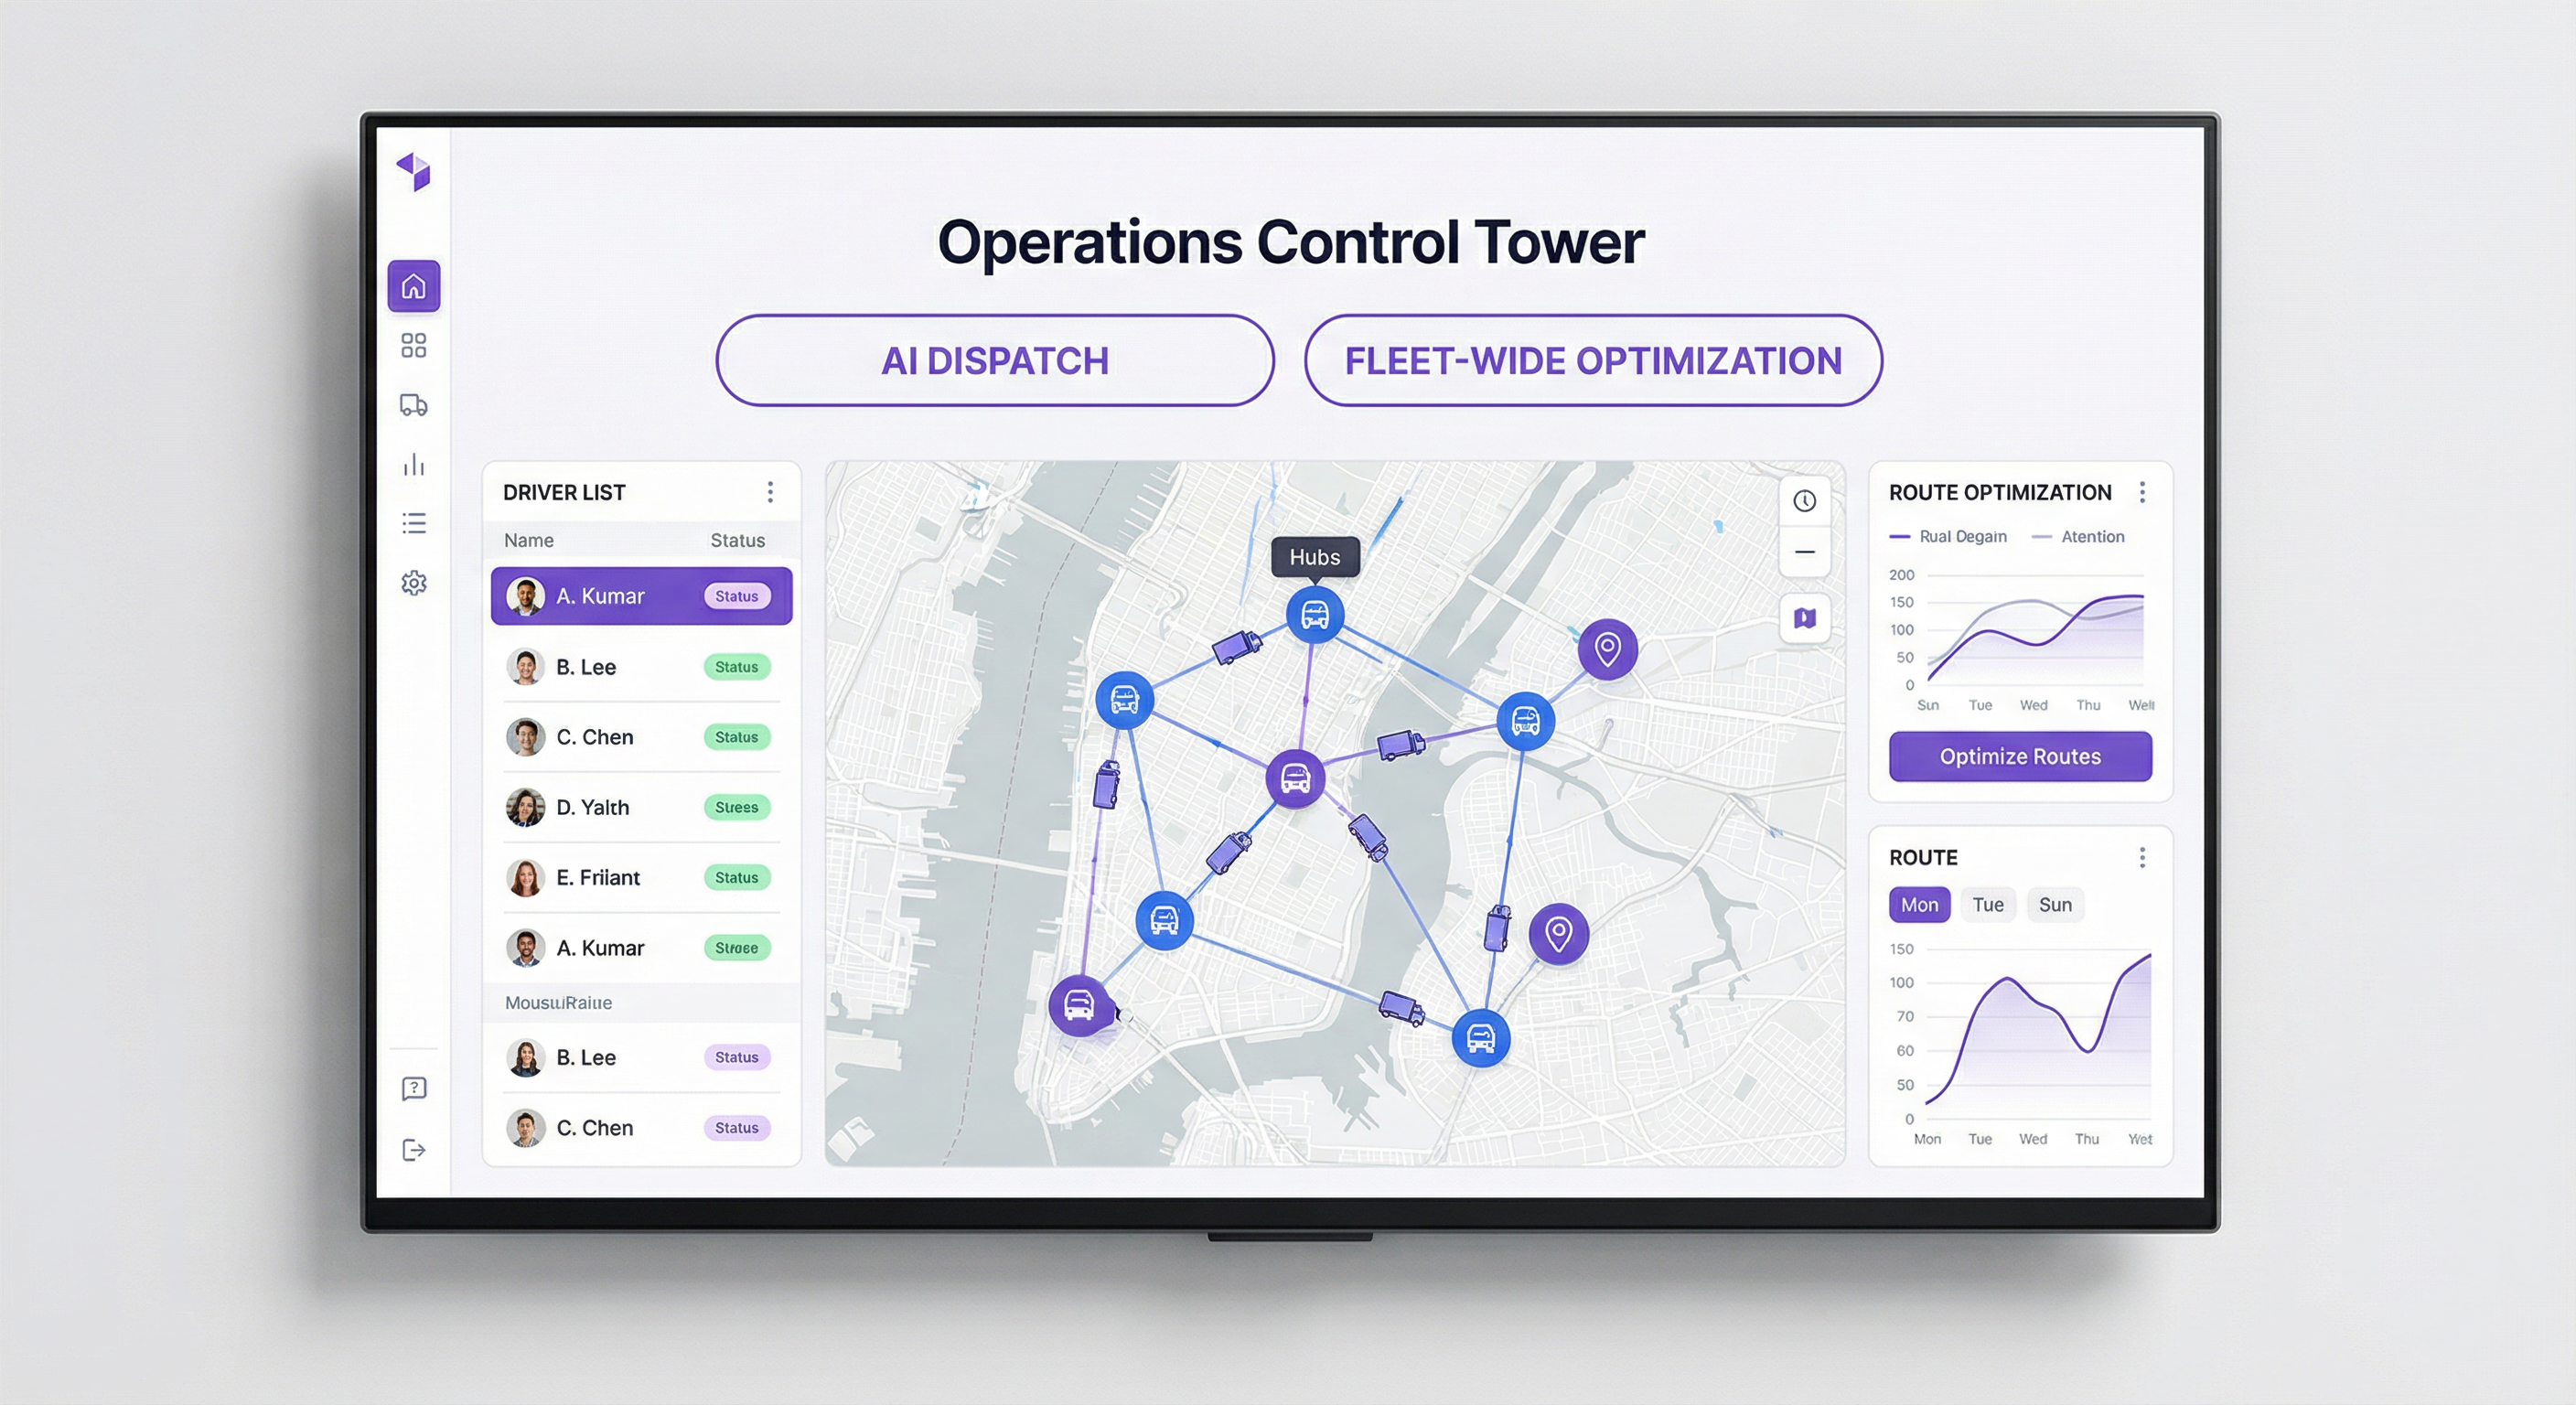
Geofleet was deployed to optimize routes using real-time traffic, vehicle capacity, and time windows. Drivers received optimized sequences and turn-by-turn navigation in the Geofleet app, reducing wrong turns and backtracking. Managers used the control tower to monitor live progress and intervene only when needed.
Results
Within six months, average miles per delivery dropped by 30%, directly reducing fuel spend. Stops per driver per day increased by 40% without adding vehicles or overtime. On-time delivery reached 95%, and driver feedback was positive due to clearer instructions and less stress.
Crucially, the operation now had a single number for fuel cost as a percentage of revenue — and watched it fall from 22% to 15%. That swing turned a margin under steady pressure into headroom the business could reinvest in growth.
Why it mattered
For a courier operator, fuel and mileage are among the few large costs that are truly controllable without cutting service. With prices rising, every wasted mile was eroding a margin that was already thin. Reclaiming 30% of mileage was the difference between absorbing fuel inflation and passing it on to customers.
Adding 40% more stops on the existing fleet also deferred capital spend: the operator could take on more volume before it ever needed to buy or lease another vehicle, improving return on assets across the board.
Lessons
The team credited two things for the durable result. First, baselining mileage and stops before go-live, then running an A/B comparison against legacy routing, made the savings undeniable to both finance and drivers. Second, treating optimization as continuous rather than one-off — the AI keeps learning from completed deliveries — meant the gains compounded instead of decaying as the network changed.
They also found that driver buy-in mattered as much as the algorithm. Because the optimized routes genuinely made drivers’ days easier, adoption was fast and the team didn’t fight the system.
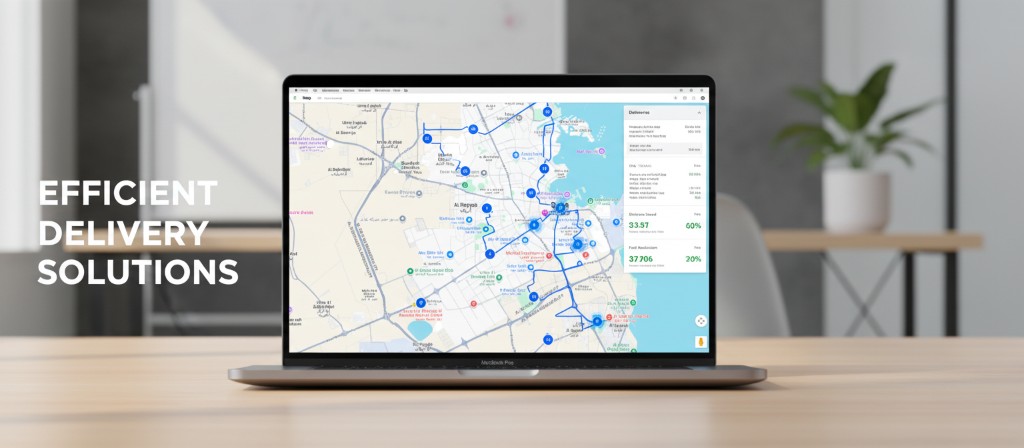
Efficiency and cost metrics
Before vs after (6-month period)
| Metric | Before | After |
|---|---|---|
| Avg. miles per delivery | 8.2 mi | 5.7 mi |
| Stops per driver per day | 18 | 25 |
| On-time delivery rate | 88% | 95% |
| Fuel cost as % of revenue | 22% | 15% |
Fleet-wide impact
Implementation timeline
Order and driver data connected; baseline mileage and stop counts captured.
Subset of drivers on optimized routes; A/B comparison with legacy routing.
All drivers on Geofleet; traffic and time-window tuning.
Continuous learning; monthly reporting on miles, stops, and on-time rate.
Key takeaways
- AI route optimization with real-time traffic cut average miles per delivery by 30%, directly lowering fuel spend.
- Stops per driver per day increased by 40% without adding vehicles or overtime.
- Unified control tower and driver app reduced backtracking and improved on-time delivery to 95%.
- Clear routes and navigation improved driver satisfaction and reduced in-route confusion.
- Fuel cost as a percentage of revenue fell from 22% to 15%, and added capacity deferred new-vehicle spend.
Frequently asked questions
How did route optimization cut fuel costs by 30%?
Geofleet builds the shortest viable multi-stop routes using live traffic, vehicle capacity, and time windows, and gives drivers turn-by-turn sequences that eliminate backtracking and wrong turns. Average miles per delivery fell from 8.2 to 5.7, which directly reduced fuel burn fleet-wide.
How could drivers complete 40% more stops without working longer?
The productivity gain came from tighter routing, not longer hours. By removing idle time and unnecessary mileage, stops per driver per day rose from 18 to 25 with the same fleet — no extra vehicles or overtime required.
How long did it take to see the savings?
The full results landed within six months. The team baselined mileage and stop counts in the first few weeks, ran a pilot with A/B comparison against legacy routing, then rolled out fleet-wide before reaching steady state.
Does optimization make life harder for drivers?
It was the opposite. Drivers received clear, optimized sequences and navigation in one app, which reduced wrong turns and in-route confusion. Driver feedback was positive because the day was less stressful and more predictable.
How does management keep visibility without micromanaging?
Managers monitor live progress in the control tower and intervene only when needed — for example, when a stop runs late or a route needs rebalancing. This manage-by-exception approach improved first-attempt success while keeping drivers autonomous.
"Route optimization cut our daily mileage by 30% across the fleet. That translates to significant savings every month in fuel alone."
Operations · Couriers & Logistics
Related case studies

80% fewer delivery disputes with ePOD and AI validation

AI dispatch replaced multiple full-time dispatchers with zero errors
80% less route planning time, 97% on-time delivery
Get similar results
See how Geofleet can help your team. Start free or book a tailored demo.